|
|
|
|
|
|

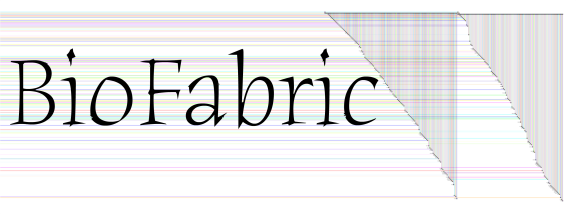
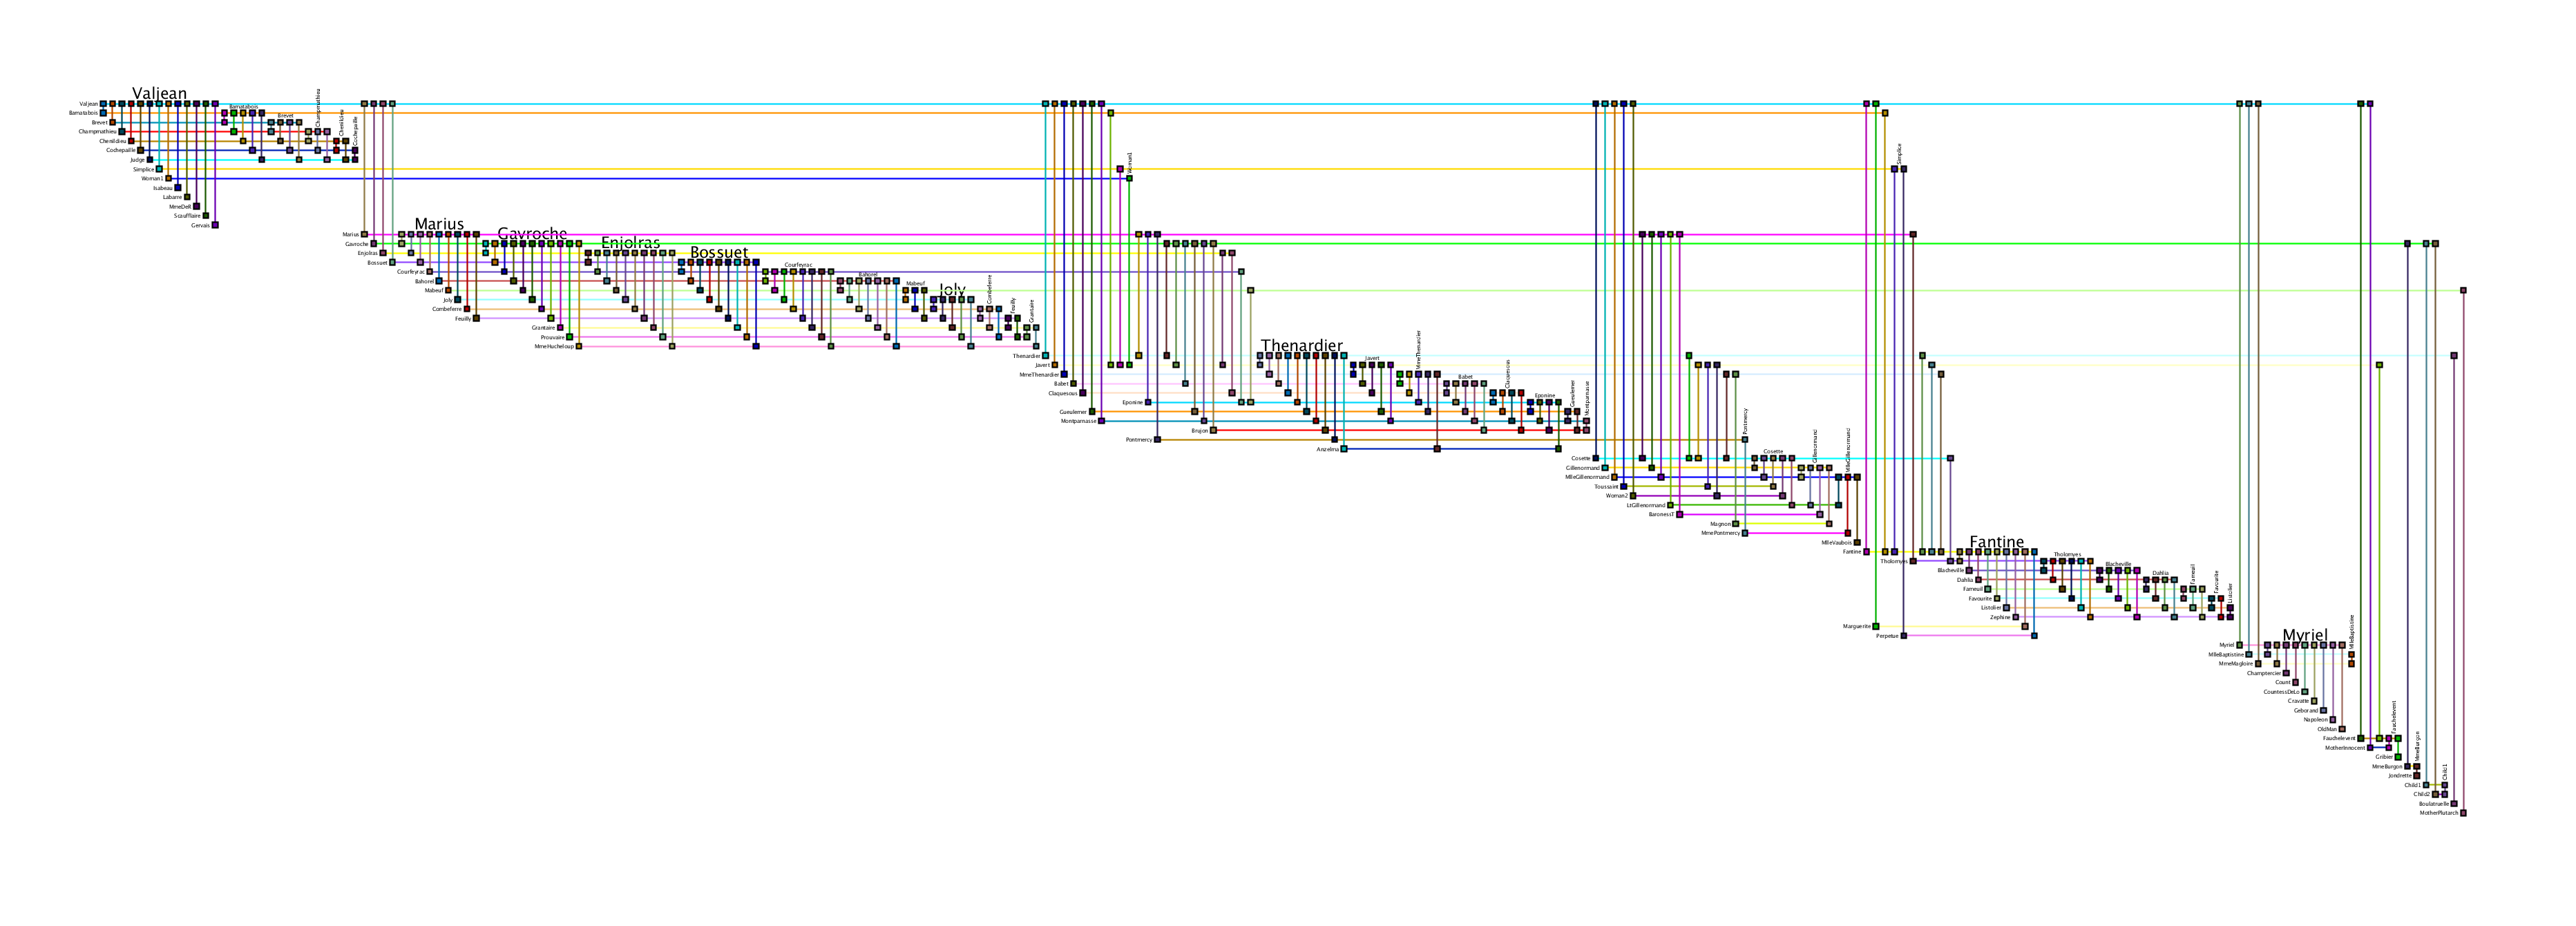
Larger image: LesMizLarge.png (3729 x 1340 pix, 167 KB)
BioFabric .bif file: lesMiserablesClustered.bif (91.7 KB)
Original Data Source: lesmiserables.gml.zip
Credit: Downloaded from the Gephi Datasets wiki page 02/13/13. Original source: D. E. Knuth, The Stanford GraphBase: A Platform
for Combinatorial Computing, Addison-Wesley, Reading, MA (1993).
 Full Network
 Left Detail
Larger image: wiki-vote-10K.png (10300 x 826 pix, 4.0 MB)
BioFabric .bif file (zipped): WikiVote.zip (3.1 MB)
Original Data Source: wiki-Vote.txt.gz
Type: Directed Nodes: 7115 Edges: 103689
Credit: Downloaded from Wikipedia vote network page, part of
the Stanford Large Network Dataset Collection.
 Full Network
 Screenshot
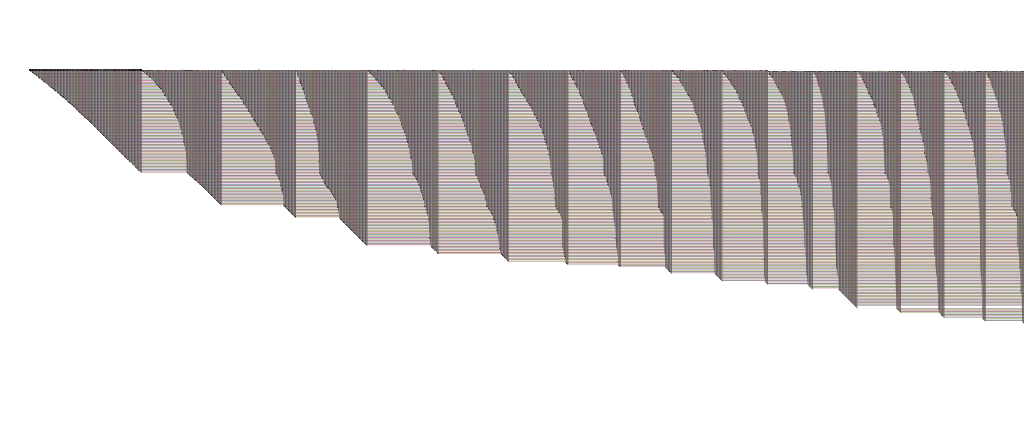
Larger (very low resolution) image: StanfordWeb10K.png (11075 x 1350 pix, 1.6 MB)
Largest (still very low resolution) image: StanfordWeb30K.png (31173 x 3800 pix, 13.0 MB)
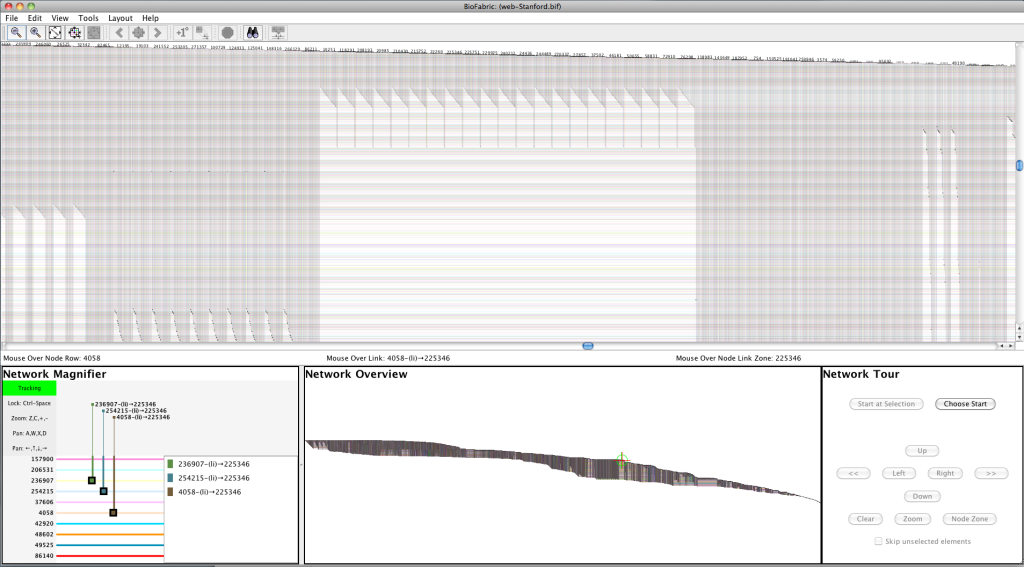
Larger screenshot: StanfordWebScreenShot.png (1907 x 1055 pix, 478 KB)
Original Data Source: web-Stanford.txt.gz
Type: Directed Nodes: 281903 Edges: 2312497
Credit: Downloaded from Stanford Web Graph page, part of
the Stanford Large Network Dataset Collection.
 Full Network
 Screenshot
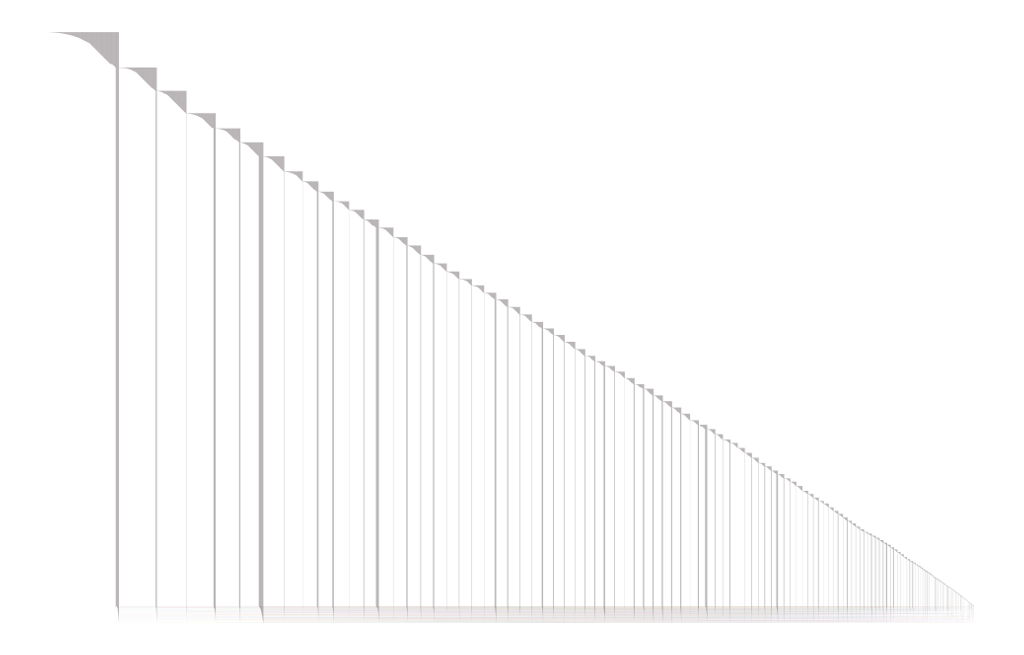
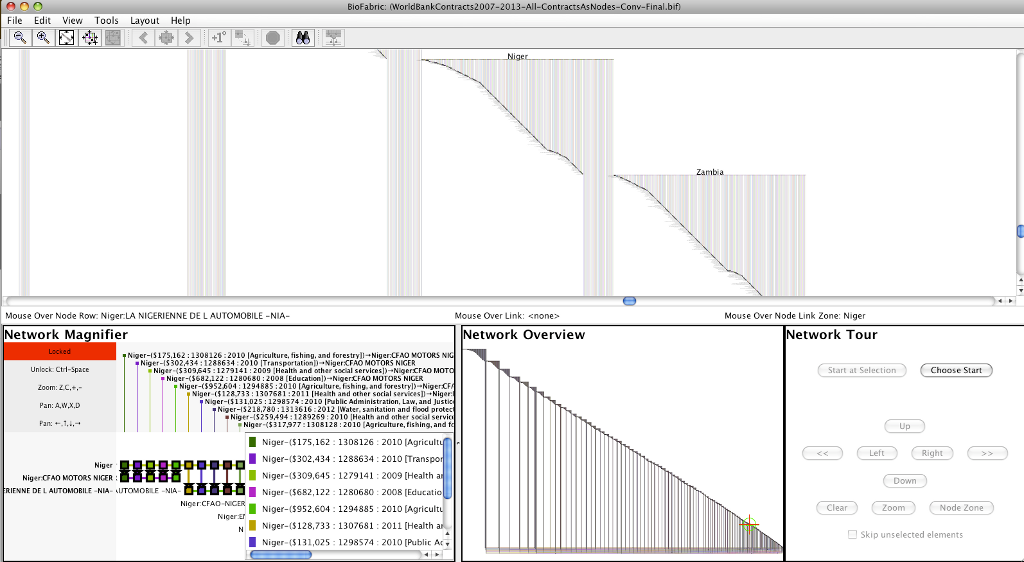
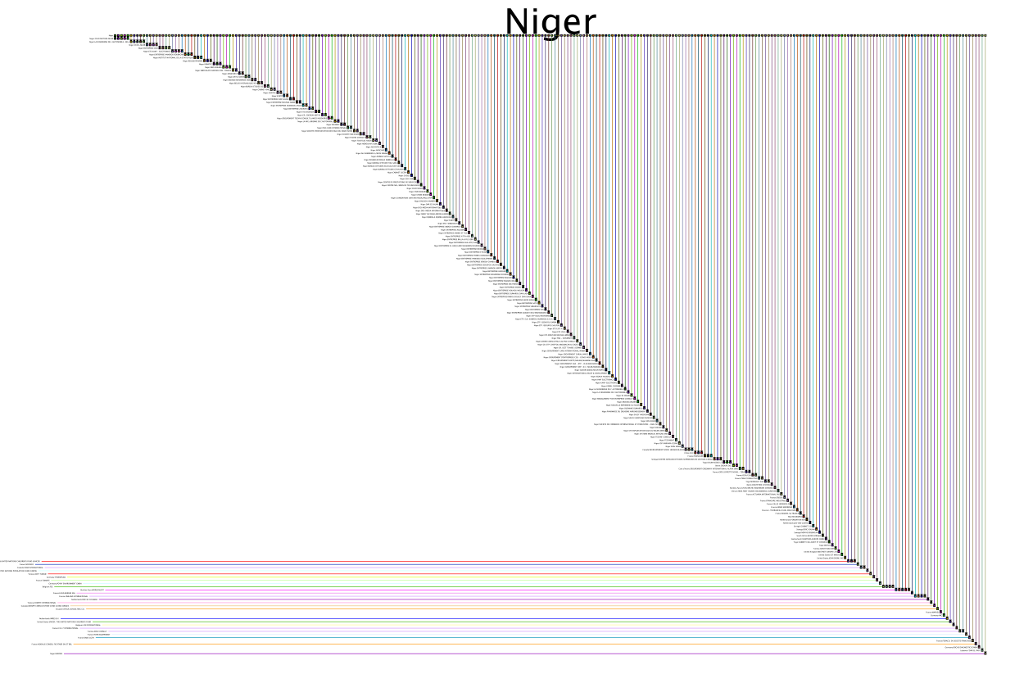 Submodel
Larger (very low resolution) full network image: WorldBankContracts2007-2013.png (15000 x 9593 pix, 5.1 MB)
Larger screenshot: NigerDetailScreenShot.png (1591 x 875 pix, 190 KB)
Larger submodel: NigerSubmodel.png (10000 x 6762 pix, 1.5 MB)
BioFabric .bif file (zipped): WorldBankContracts2007-2013.bif.gz (5.4 MB)
Original Data Source: Major_Contract_Awards.csv
Nodes: 44,213; Edges: 66,021
Credit: Downloaded from The World Bank Finances page, part of
the World Bank Data Resource.
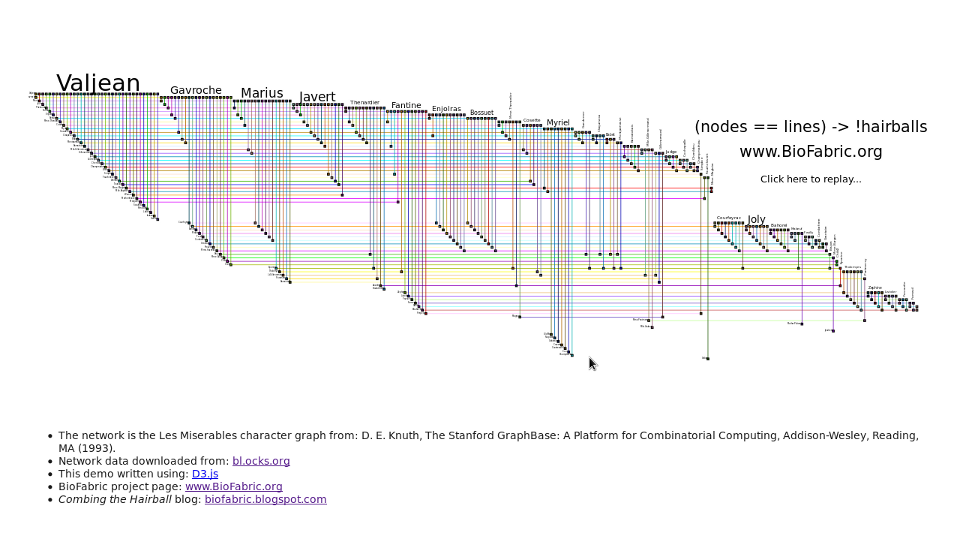
A quick animated demo of BioFabric of BioFabric written using D3.
Just the network displayed (no animation). Use this source if you just want to try displaying your own network, though it is just the code used in the above demo. Thus, it (probably) will not handle multiple components, singleton nodes, or duplicate links correctly!
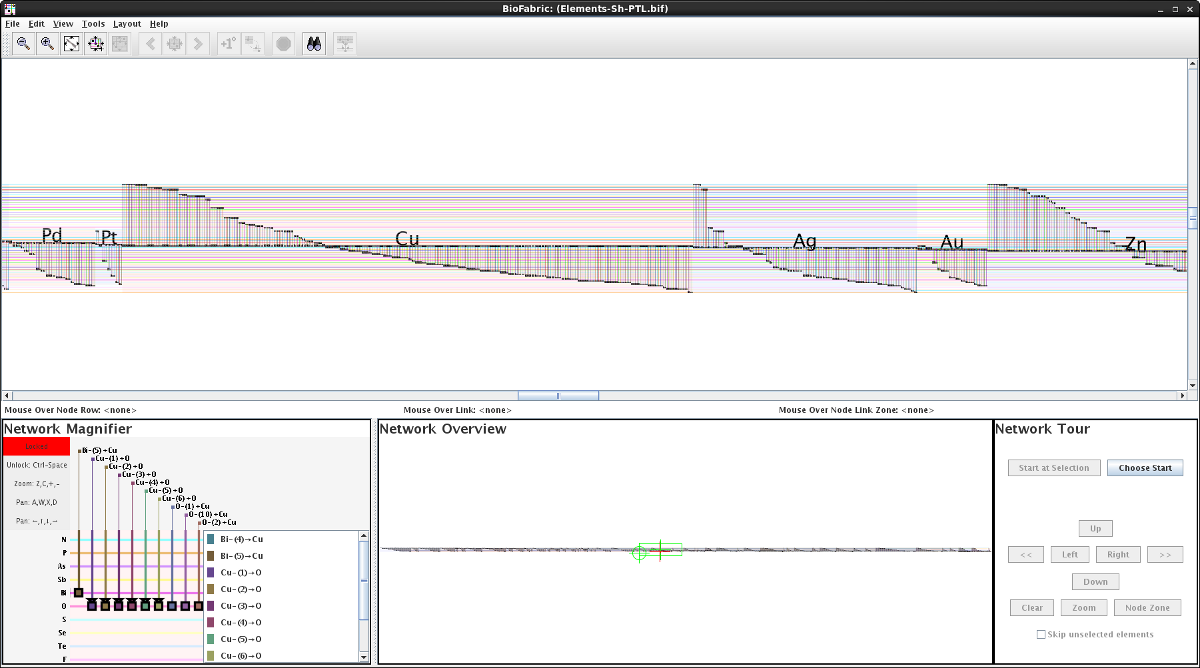 Cu-Ag-Au Screenshot
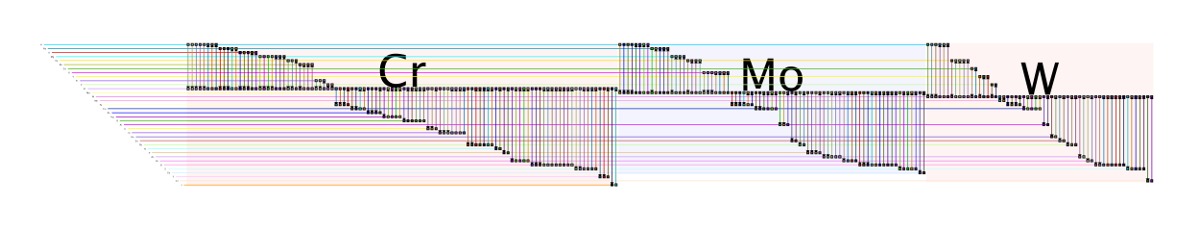 Cr-Mo-W Submodel
This network data set was used as part of a Circos table example. In this BioFabric example, I use a technique (hack?) to mimic the effect of fat and thin edges between nodes by creating a multi-graph. The number of edges between two elements is equal to the rounded base 2 log of the value in the adjacency matrix cell. If that number was less than or equal to 0, there is a single edge. Each edge is labled with its corresponding log value. Since the data matrix is not symmetrical, this is a directed graph. One change from the provided data is that the entries for two phantom elements "R" and "E" were discarded. They appear to be present due to a parsing error of the tag "REE" (rare earth element), which were apparently not correctly omitted.
The rows were explicitly laid out with a .noa attribute file such that the periodic table is traversed column-by-column starting from hydrogen.
Full network image (low resolution): Minerals24K.png (24000 x 215 pix, 569 KB)
Larger screenshot: Cu-Ag-Au.png (1801 x 1003 pix, 159 KB)
Larger submodel: Cr-Mo-W-Sub.png (5000 x 970 pix, 121 KB)
BioFabric .bif file (zipped): Elements-Sh-PTL.bif.gz (128 KB)
Original Data Source: table.txt
Credit: Downloaded from Example - a large real data set - reactivity of chemical elements in minerals page, part of
the Circos Vis Tables1 Example.
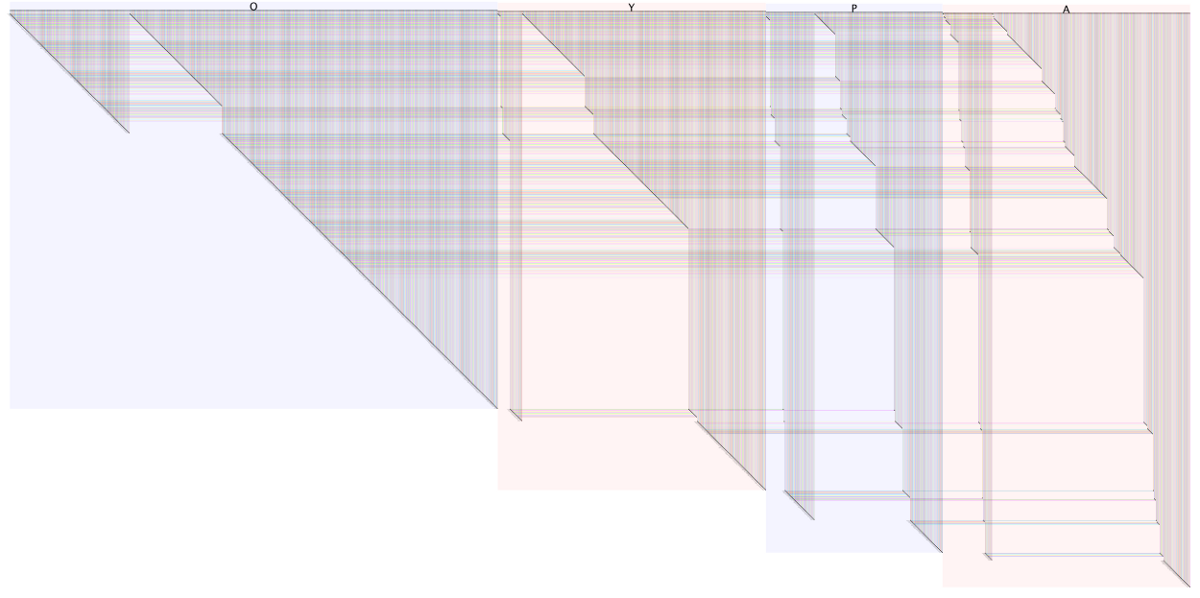 Combined Networks for Glucose and Oleate Conditions
This network is discussed at length in three blog posts:
It uses data from this paper:
Smith, J.J., Ramsey, S.A., Marelli, M., Marzolf, B., Hwang, D., Saleem, R.A., Rachubinski R.A., and Aitchison, J.D. Transcriptional responses to fatty acid are coordinated by combinatorial control, Molecular Systems Biology, 2007, 3:115This particular example shows how the networks for two different experimental conditions can be combined and visually compared in one single network using BioFabric's link groups feature. Many other images are provided in the above-linked blog posts.
In addition to the .bif file, the node attribute (.noa) files used to rearrange the nodes to provide the different edge wedge arrangments are also provided below. Consult the blog posts for further details.
BioFabric .bif file: OleateGlucoseCombinedCompare.bif (474 KB)
"Odometer" .noa file: 001_comb-ODOMETER.noa (9 KB)
Glucose Baseline .noa file: 001_comb-GLUCOSE_BASE.noa (9 KB)
Oleate Baseline .noa file: 001_comb-OLEATE_BASE.noa (9 KB)
Original Data Source: Supplemental Materials
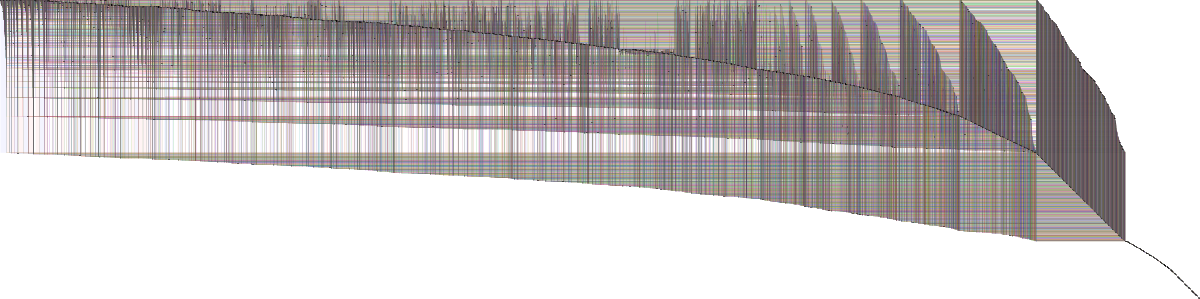 BioFabric Version of Brendan Griffen's Graph of Influential Thinkers
This network is now being discussed on the BioFabric blog:
You will find many more screen shots of parts of the network in that blog post.Brendan Griffen has used the "influenced" and "influenced by" links on Wikipedia pages to create a "Graph of Influential Thinkers", which he discusses in a blog post. This is a BioFabric version of that network, laid out using the "similar connectivity" layout algorithm. The .bif file (in a compressed gzip archive file) for the network is provided below.
BioFabric .bif file in a gzip archive: SimpleGOT-Conn3X.bif.gz (944 KB)
Network Statistics: 7,239 nodes and 14,560 edges
Original Data Source and Credit: Data was graciously provided by Brendan Griffen
Last updated: September 11, 2014
wlongabaugh -at- systemsbiology -dot- org